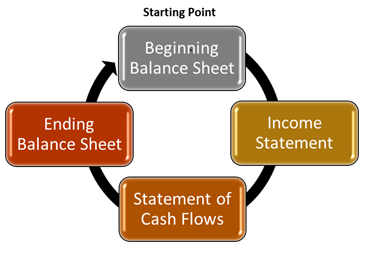
The correct answer is all of them. The problem is that many people don’t understand all of the financial statements and how they are connected.
The balance sheet is a list of resources (assets) that you have to work with and obligations (liabilities) that you have a responsibility to satisfy (pay). The difference between these (assets – liabilities) is the equity. The balance sheet is always “at” a specific date, a snapshot in time. Your goal is to utilize the assets in operations, to create income and cash flow that will allow you to build assets and/or decrease liabilities, thereby giving you more net resources (assets – liabilities) to use in operations going forward.
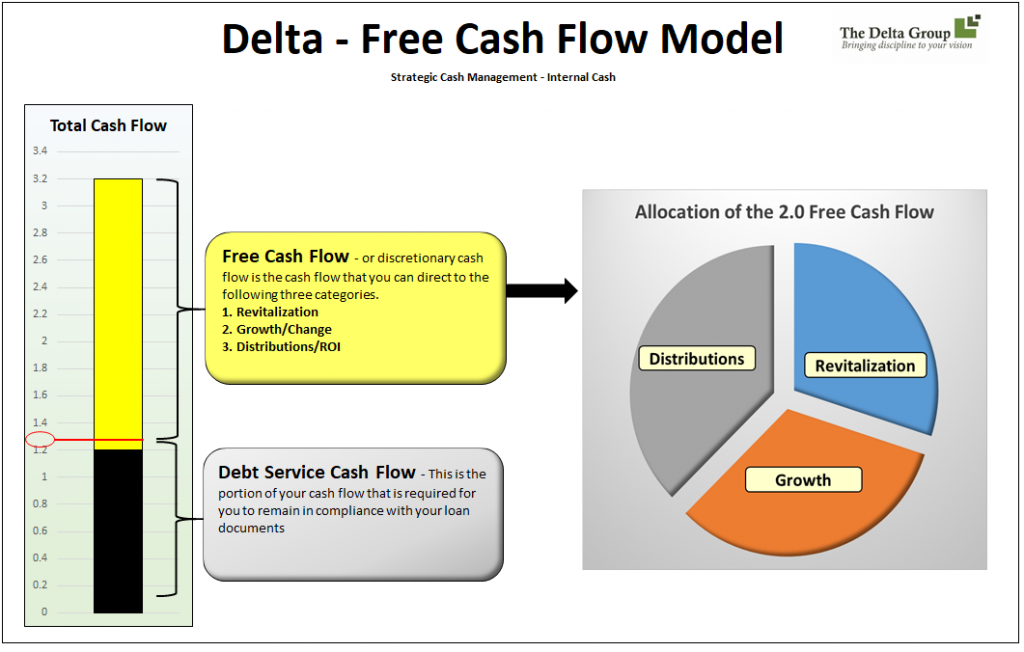
The income statement covers a period of time (month, quarter, year) and summarizes the results of operations in the form of net income. From this statement, you can calculate EBIDA which is Earnings Before Interest, Depreciation and Amortization, sometimes referred to as cash flow. How much net income (or EBIDA) is enough? That depends. This is where the Delta Free Cash Flow model comes into play. The yellow and black bar on the left is your total cash flow. The black portion is reserved for debt service. The yellow portion is your free cash flow which you decide how to utilize. There are three options for your free cash flow- revitalization, growth, and ROI (return on investment).

The statement of cash flows is the connection between the income statement and the balance sheet. There are three basic sections of the cash flow statement:
- Operating, which is net income + depreciation & amortization +/- changes in current assets and current liabilities (working capital items)
- Financing, which are debt sources and payments +/- equity sources and payments
- Investing, which is the acquisition of fixed or other assets
The income statement defines how much cash the company has generated. The changes in the balance sheet during the same time frame (defined in the cash flow statement) show what the company did with the cash that was generated.
Historical vs Forecast
To add to the complexity of the three financial statements, you can look at the historical statements or the forecasted statements. The historical statements show cause and effect. The financial statements are a direct result of the strategies implemented in that time frame. For example, if you raise your prices 5% and you generate the same volume of business, your sales will increase, profit will increase, and cash flow will increase. You will have more cash on the balance sheet or you will have invested that cash into some other item on the balance sheet (ie. fixed assets, debt reduction, etc.).
Why we succeed
We set up our financial model to look at both historical and forecasted financials. We invest time with the company’s management to explain some of the insights we see in the financials, discuss the cause and effect, then forecast based on that cause and effect. If the outcome of the forecasted financials does not satisfy the needs and goals of the company, management needs to change what it’s doing. Changes are mapped out mathematically so we can see the results of a plan before the plan is implemented. It’s that simple.
Final Advice
We have found that companies that understand the numbers and manage by the numbers are successful. Invest time, monthly, to learn more about your numbers and apply what you’ve learned to your forecast. Over time, you will understand more about the behavior of your numbers, your forecast will become more accurate, and you will have more control over your destiny.

